


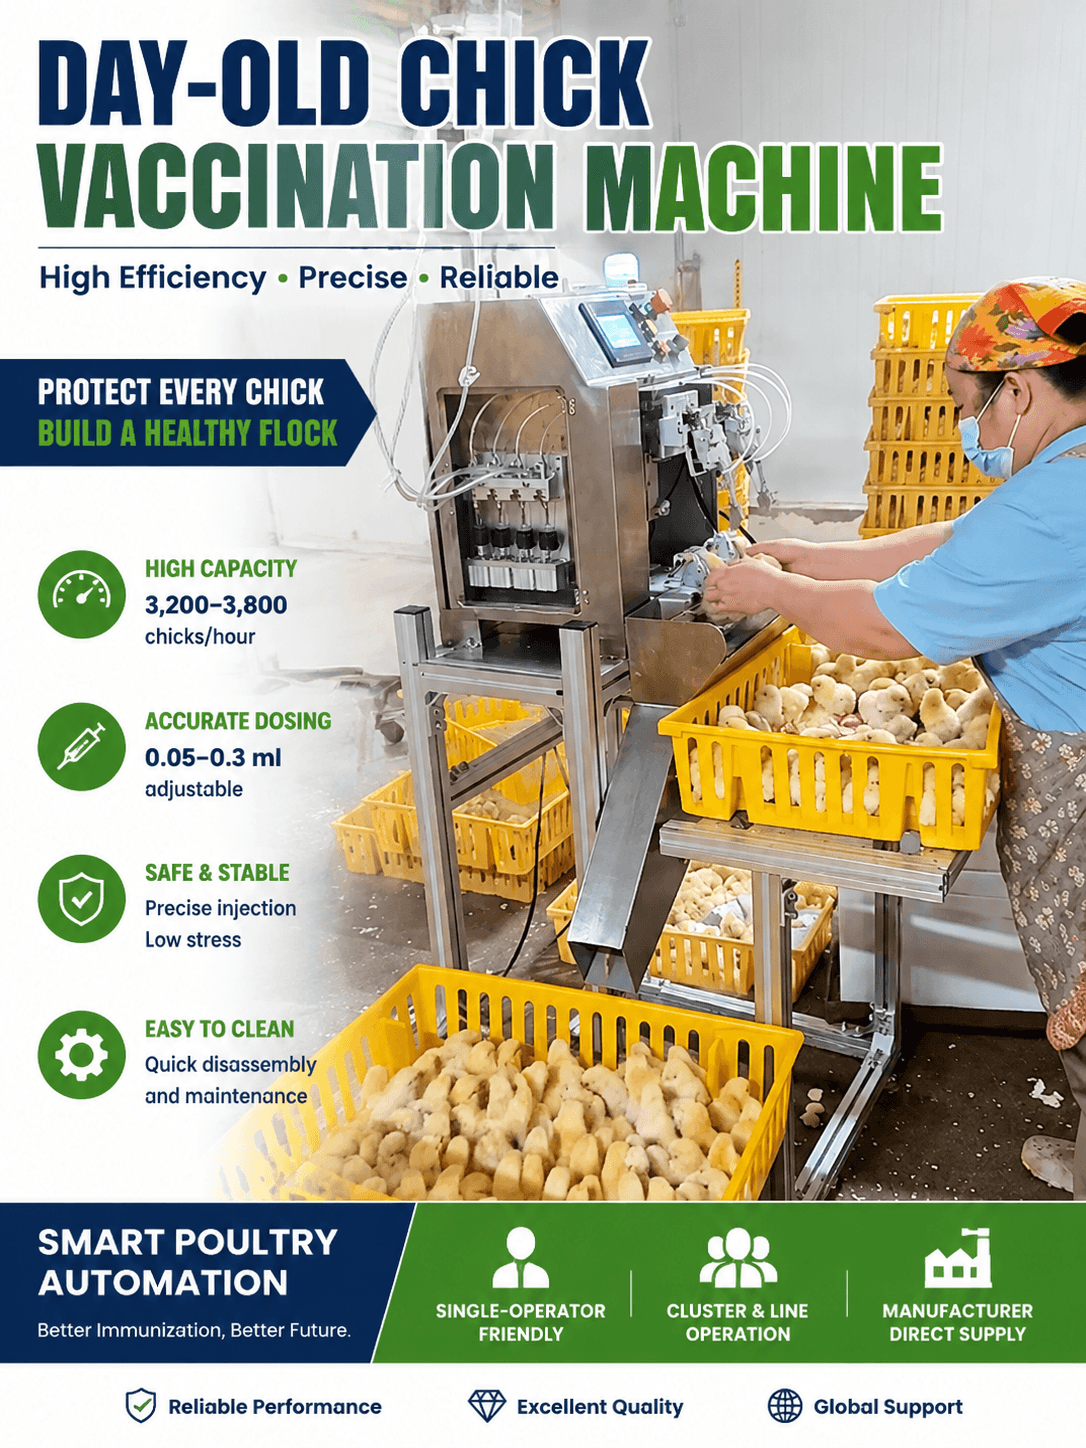
Capacity is often written as a single number on a quotation. In a hatchery, it is a sequence of small timings: tray arrival, bird presentation, injection, inspection, transfer and the pauses needed to clean or reload. A useful chick vaccination machine capacity number is the rate the team can repeat while dose quality and bird handling remain within the agreed standard.
That is why two machines with the same headline rate can produce different results in two rooms. The surrounding conveyor, operator rhythm, vaccine changeover and tray mix all matter. Measure the whole handoff before comparing brochures.
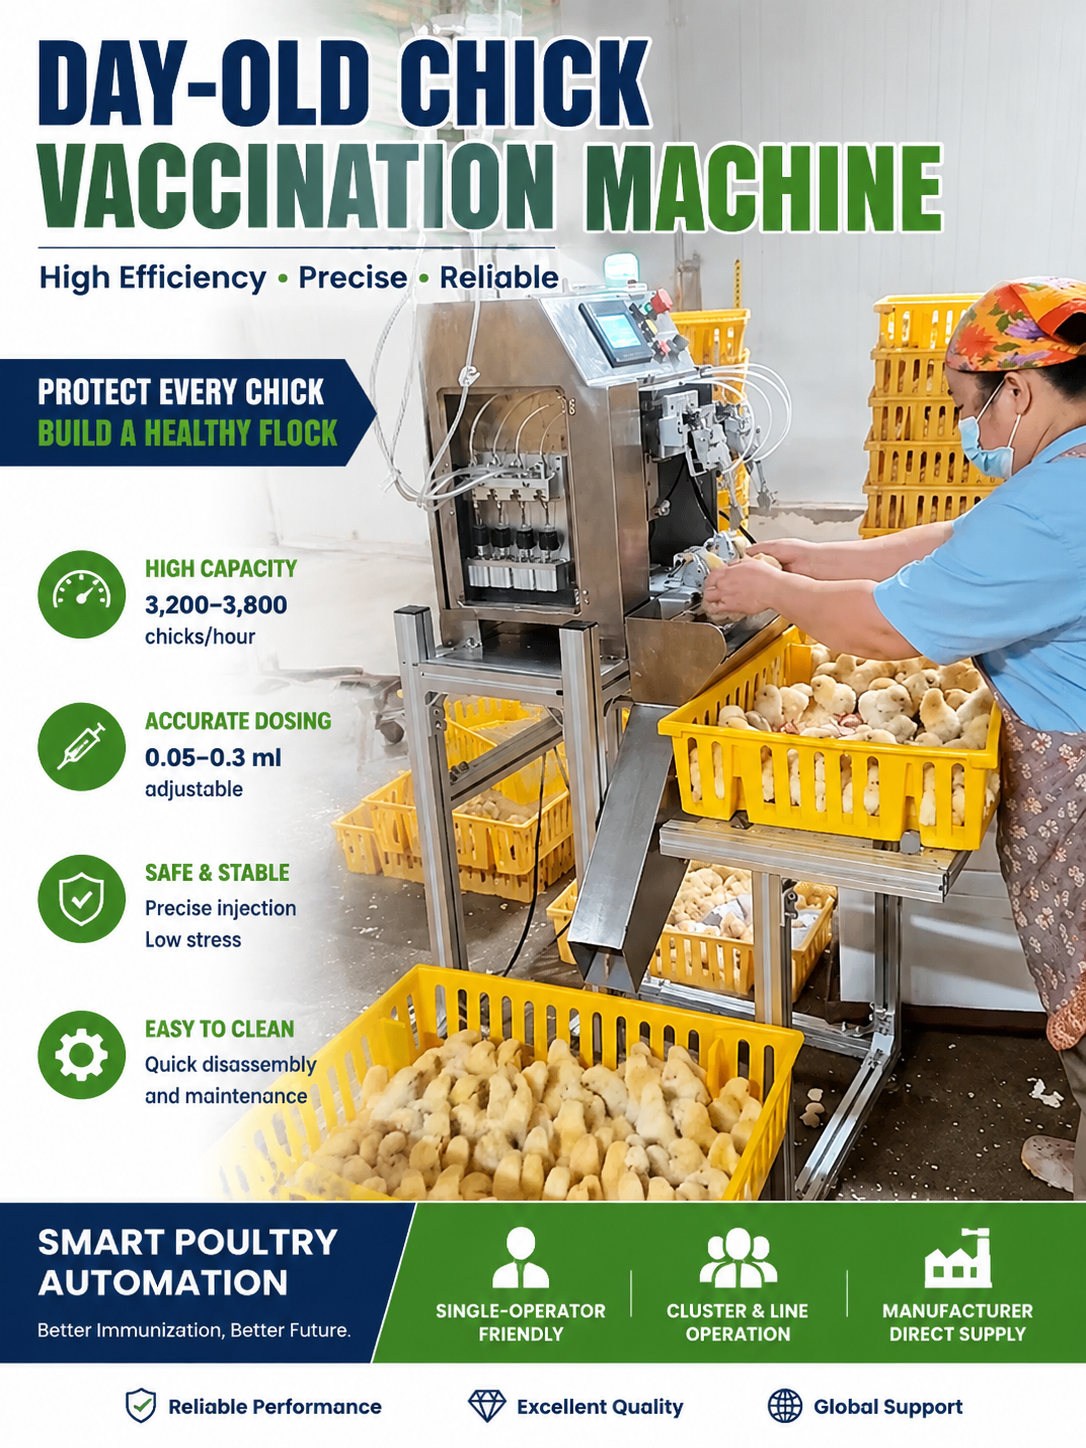
Define the capacity you actually need
Begin with the dispatch promise. Write the number of chicks per hatch day, the available operating window, the planned breaks and the time reserved for sanitation. Then calculate the required average rate. This is more honest than taking a peak rate from a short demonstration.
Use the room clock
If 18,000 chicks must leave in six productive hours, the room needs an average of 3,000 chicks per hour before any allowance for stoppages. Add a realistic recovery margin rather than pretending that every minute is productive. The margin should be based on observed stops, not a convenient round number.
Separate peak from sustainable
A short peak can prove that the mechanism is capable. It does not prove that operators can feed trays, confirm needles and maintain hygiene at that rate for a complete shift. Record both rates and label them clearly in the project file.
Measure the cycle in five places
During a site walk, use a stopwatch or a simple video review to capture five events. The goal is to find the first queue, because that is where capacity is being lost.
| Measurement point | What to record | Why it changes the result |
|---|---|---|
| Tray arrival | Seconds between usable trays | An empty infeed starves the injector |
| Bird presentation | Time for birds to settle into the presentation path | Uneven trays create pauses and re-handling |
| Injection cycle | Time from first to last programmed action | This is the machine’s visible headline rate |
| Quality confirmation | Dose, needle and bird-condition checks per batch | A fast cycle that needs repeated correction is not sustainable |
| Exit and handoff | Time to the next conveyor, crate or operator | A downstream queue turns speed into waiting |
Plot these timings over at least one normal batch. The slowest repeatable section is more important than the fastest ten-minute sample.
Use the result as the working chick vaccination machine capacity for layout and staffing decisions. Keep the peak value in the technical record, but do not let it drive the dispatch plan.
Watch the first and last tray
The first tray exposes setup time, while the last tray exposes fatigue, cleaning and dispatch pressure. Include both when you calculate chick vaccination machine capacity. A line that performs well only in the middle of a shift will still miss a truck window.
Record stoppage reasons, not only minutes
Tag each pause as machine, tray, operator, vaccine, cleaning or downstream. A capacity improvement aimed at the wrong category simply moves the queue. The tag list also gives the supplier a more useful commissioning brief.
Protect dose quality while you chase rate
Throughput is valuable only if the vaccine is delivered correctly and birds are handled consistently. Set the quality gates before you run a capacity trial. Include dose-volume checks, needle condition, reject reasons, cleaning intervals and the record that proves the check happened.
Choose the right test batch
Use representative trays, not unusually calm or perfectly uniform samples. If the hatchery handles different breeds, weights or tray formats, run the trial against the most demanding routine that the line must support. A rate based on the easiest batch is a weak planning number.
Make changeovers visible
Needle checks, vaccine preparation and sanitation are production events. Put them on the same time line as the injection cycle. The JuliSense injection vaccinator page is a useful starting point for configuration questions, while the service page helps frame training and commissioning support.
Compare scenarios with one worksheet
A buyer can compare options without building a complex model. Keep the inputs visible and record the assumptions that separate a single station from an integrated room.
| Scenario | Productive hours | Sustainable rate | Daily output | Main constraint to verify |
|---|---|---|---|---|
| Current manual room | 5.5 | Measured baseline | Baseline | Handling and labour |
| Standalone injector | 6.0 | Trial average | Rate x hours | Infeed and operator rhythm |
| Integrated line | 6.0 | Trial average less handoff loss | Rate x hours | Conveyor, take-off and cleaning |
| Peak-season plan | 6.5 | Lower-bound repeatable rate | Rate x hours | Staffing and recovery margin |
The table should be completed using measured values. If a number is still a supplier estimate, mark it as an estimate. A transparent unknown is safer than false precision.
Plan people around the bottleneck
Adding an operator does not always increase capacity. If the injector is full, a second person may only create a queue. If the infeed starves, the right person may be needed at tray preparation rather than at the controls. Map responsibility for feeding, quality checks, cleaning and exception handling before the trial.
Review the working chick vaccination machine capacity after operators settle into the routine. A stable daily number is more useful for production planning than the best cycle recorded during commissioning.
Give each station a fallback
Write down who takes over when an operator leaves for sanitation, a tray is damaged or a vaccine check fails. A line that depends on one experienced person may have a high demonstrated rate but a fragile daily rate.
Train for the slow event
Commissioning should include the restart after a planned stop and the restart after a fault. Those are the moments when a team loses more time than during a steady cycle. Record the recovery time and include it in the capacity model.
Questions buyers ask about chick vaccination machine capacity
Should we size for the largest hatch day?
Size for the largest credible day plus a sensible recovery margin, then check whether the equipment can run economically on ordinary days. A machine that is oversized for most of the year can create unnecessary capital and training costs.
Is the supplier’s hourly number enough?
No. Ask whether it is peak or sustainable, what tray format was used, how quality was checked and whether cleaning or changeover time is included. Request a site-specific trial whenever the project depends on a narrow dispatch window.
What if the bottleneck is after vaccination?
Then a faster injector alone will not improve the room. Review the conveying and stacking line, the take-off point and the crate path. The full product range helps keep the comparison at system level.
Turn the trial into a purchase decision
Finish with a one-page record: measured rate, quality result, stop tags, staffing, utilities, cleaning time and the assumptions used. Share it with the supplier and the internal approver. The best chick vaccination machine capacity decision is the one that can be explained after the first busy hatch, not only during the quotation meeting.
For a scope review, send the hatch volume, tray format, room clock and downstream handoff through contact us. A clear timing question gives JuliSense a better starting point than a target number copied from another plant. Company and project context are available on the about us page, and routine operating questions are collected in the FAQ section.