


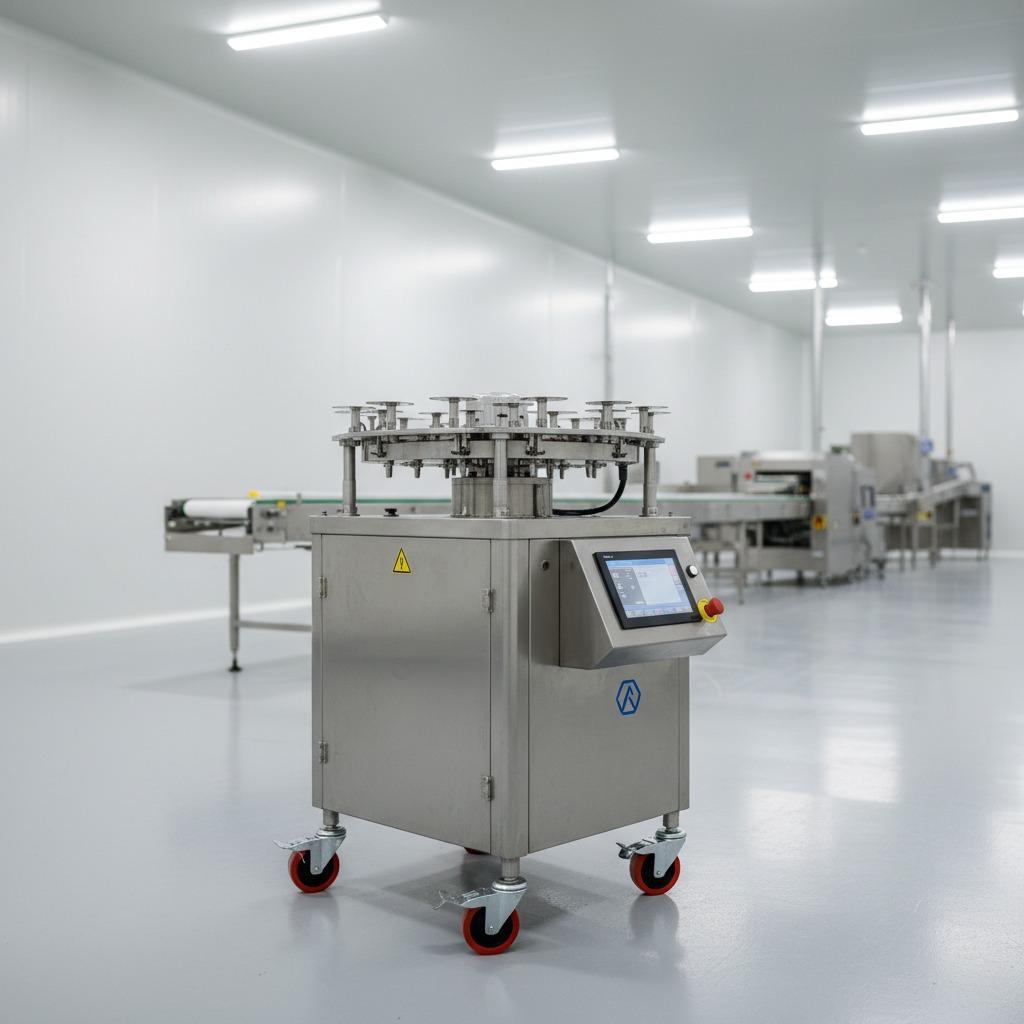
Walk into an automated chick room at two in the morning and the machines will tell you almost nothing. A green light says a station is running. It does not say whether the count is short, whether a lane is blocked, or whether the vaccination head has been waiting eight minutes for a tray that never came.
A hatchery automation monitoring system exists to close that gap. Not by adding another control room, but by putting a small number of meaningful figures in front of whoever is on shift.
What a monitoring system is not
It is not a replacement for walking the room, and it is not a dashboard that shows everything a controller can read. Systems designed around available data tend to produce screens nobody looks at.
What works is narrower. Pick the few figures that would change a decision within the same shift, and make sure they are visible from where the operator actually stands. Everything else belongs in a weekly report.
Narrow is not the same as shallow. A hatchery automation monitoring system earns its place when it removes a question, not when it adds a screen.
The three-second test
A shift supervisor should be able to read the screen in three seconds and know whether the night is going well. If it takes longer than that, the display has become an archive.
Five numbers worth watching
Across the lines we build, the same five figures keep earning their place. They are not a specification; they are a starting point to adapt to the plant.
If a figure would not change what anyone does before the shift ends, it does not need to be on the wall.
Throughput and unplanned stops
Not the rated speed, which nobody needs reminding of, but the actual figure for the current hour and the count of stops since the shift began. Together they separate a slow night from a broken one.
Count reconciliation
Whatever the line counts should agree with what was packed. Showing both sides of that comparison, rather than a single total, is what turns the number into a check.
Treatment and vaccination coverage
Birds that passed the station, against birds that went through the line. A difference here is worth knowing about during the shift rather than during the following week.
Cleaning completion
Sanitation is the task most often squeezed when a shift runs late. A simple record of which sections were completed, and when, gives the quality team something to stand on.
Alarms raised and cleared
Not a live alarm list, which the machine already shows, but the pattern across a shift. Three stops in the same lane is a different story from three stops across the room.
| Figure | Why it changes a decision | Typical source |
|---|---|---|
| Hourly throughput | Tells the supervisor whether to intervene now | Line controller |
| Unplanned stops | Separates a slow night from a failing station | Line controller |
| Count against packed | Catches drift before dispatch | Counting and packing records |
| Treatment coverage | Confirms every bird passed the station | Station counter |
| Cleaning completion | Protects the next hatch day | Operator record |
Making the data trustworthy
Monitoring fails for human reasons far more often than for technical ones. Three habits keep the figures usable.
One owner per figure
Every number on the screen should belong to a named role. If two people believe the other is checking it, neither is.
Recording at the moment, not from memory
Entries reconstructed at the end of a shift drift towards the expected answer. A short prompt at the workstation, or an automatic capture, is worth more than a detailed form completed at seven in the morning.
Names that survive staff changes
Section names, lane names and crate codes should match the drawing on the wall. When a label in the system does not correspond to anything in the room, people stop trusting the screen.
What to do when a number moves
Data is only useful if it leads to an action. Agreeing escalation levels in advance stops every variation from becoming an emergency.
| Level | Trigger | Who acts | Expected response |
|---|---|---|---|
| Watch | Small, steady deviation from the shift average | Operator | Note it and check again next hour |
| Investigate | Count and crates disagree, or a repeat stop in one lane | Shift supervisor | Inspect within the shift |
| Stop | Safety issue, or throughput falling outside the agreed window | Supervisor with maintenance | Stop the line and record |
| Report | Any event that repeats on three consecutive shifts | Plant manager | Review with the supplier |
The fourth level is the one hatcheries skip, and it is the one that produces improvements. A fault that appears three shifts in a row is a design conversation, not an operating habit.
Where monitoring connects to the rest of the line
Figures come from stations that are already doing something else. The counting arrangement described in our conveying and stacking line supplies count and stop data, while the treatment station supplies coverage. When planning a hatchery automation monitoring system, it is cheaper to agree those signals during the layout stage than to retrofit sensors afterwards.
The same rule applies to cleaning and dispatch. If those sections are going to appear in a hatchery automation monitoring system later, their records should be designed in the same way as the line signals from the beginning.
Two external references are worth keeping in the project file. The WOAH Terrestrial Code sets out biosecurity expectations that records may need to demonstrate, and the documentation practices behind ISO 9001 give a familiar structure for traceability when a customer audits the plant.
Questions buyers ask about monitoring
Do we need a separate monitoring package?
Often the signals already exist inside the stations, and the work is deciding which ones to display and where. That is why we treat monitoring as part of the line design rather than as an add-on purchased later.
The same applies to reporting: a hatchery automation monitoring system that feeds the weekly quality meeting costs almost nothing extra if it was planned at the drawing stage.
How much history should be kept?
Enough to cover the reporting the plant already produces, and long enough to compare a bad day with a normal one. Most hatcheries find a rolling record of a few weeks more useful in daily decisions than years of archived data nobody opens.
Will operators accept it?
They accept it when the screen helps them finish on time. Screens used mainly to check up on people get ignored, or worse, worked around.
Can it connect to existing equipment?
Frequently yes, subject to the interface details of the installed stations. A site survey confirms what can be read from existing machines and what needs a separate sensor.
Plan the screen before the sensors
JuliSense designs, builds and commissions day-old chick processing equipment and the controls that sit around it. If you are planning a hatchery automation monitoring system, bring us the question the supervisor should be able to answer at two in the morning, and we will work back from there. Equipment families are on the products page, integration work is covered in the service section, company background is on about us, common questions are collected in the FAQ, and project discussions start through contact us.